Need to monitor your activity via specific reports?
The Visualize module will allow you to set up customized BI and dataviz to monitor your business.
Watch the video
Usage
Tailor-made reports
100% customised
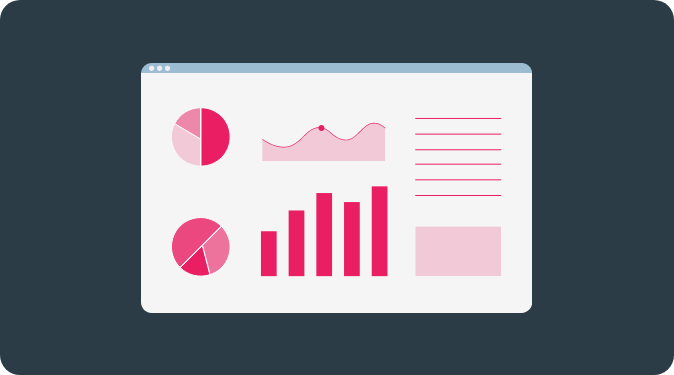
With our dashboard studio, you can integrate graphs and tables into your reports, using your data from the datamart or data from other external sources. Visualize does not require any programming skills and therefore allows you to quickly create your own customized monitoring tools.
The Visualize module allows you to create, without any line of code, tables and graphs that allow you to set up simple and meaningful dataviz tools. In this way, you can create 100% customized reports in a few minutes to accurately monitor your activity.
Opening
In addition to the data available in the datamart, you have the possibility of integrating data from external sources into your reports, whether it is data from flat files, your social networks, your web statistics or other sources. An opening to external data allowing you to customize your dashboards to the maximum level.
Get started today with datacadabra
Do you want to make the most of your data and gain in performance? Our teams are at your disposal to present you in more detail datacadabra and the gains you could obtain.