Generate dataviz
In marketing, taking action without measuring is a risk of inefficiency in action plans. Measuring performance and spreading this measurement is therefore fundamental.


Explanation
Customized reports to better manage your results with the dataviz
This is where Dataviz comes in. This powerful tool for democratizing access to data tends to become a communication tool in its own right. Dataviz is already regularly used to send us information.
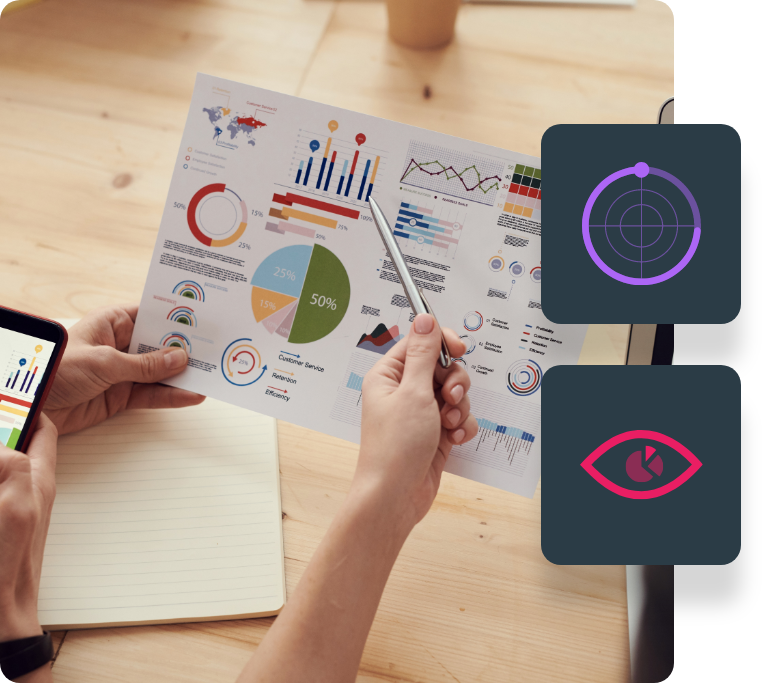
Indeed, the human brain has a marked preference for visual supports. It captures 80% of information through images. It processes visual data 60,000 times faster than numbers and texts. Our brain understands much more quickly through a visual medium that requires less work. Looking at a picture helps it to assimilate more complex data than if we read a text or a numerical table.
With the Follow and Visualize modules, you will be able to define your management tools and display them in a visual way!

Monitor your activity
You create relevant follow-up reports allowing you to follow the right KPIs.

Spread of information
You can send the reports to all your teams.

Adjustment of action plans
Thanks to your management tools, identify the actions to be adapted and set up corrective actions.