The passage matrix: a strategic tool for fine-tuning your strategy

It is essential to identify the segments to which your customers belong, in the long term it is even more relevant to analyze the transition matrix in order to improve your marketing strategy.
The challenges of segmentation: setting the foundations
If we compare data exploitation to building a house, then customer segmentation will allow us to set the foundations. Firstly, segmentation will allow you to understand the structure of the customer base and to identify the different groups to be animated. The resulting indicators will allow you to build a strategy based on customer value and loyalty. However, simply looking at the picture of the segmentation at a given time may not be enough. You must also pay attention to the transition matrix.
The interest of the transition matrix
Indeed, when analyzing segmentation, it is important to take into account long-term dynamics. In particular, it is essential to study the flow of customers between two segmentation periods, which is called the transition matrix, or flow matrix. The idea of the transition matrix is to determine in what proportion the customers of a segment at a given moment in year N will migrate to another segment in N+1. Two types of matrices can be calculated. The volume matrix allows us to know how many customers have moved from segment A to segment B between two periods. The percentage matrix will allow to measure the proportion of customers migrating from one segment to another.
Example and analysis of a datacadabra transition matrix
As an example, this percentage transition matrix will allow us to see the proportion of customers who move from one segment to another between the segmentation calculated in N-1 and the segmentation calculated in N. We are thus interested in three types of movements. The first key piece of information to analyze is the stability of clients, i.e. the proportion of clients who remain in the same segment between two dates. This information will allow us to validate the level of loyalty of high segments (VIP / TBC here). We can then analyze the upward flows, i.e. the customers who have seen their segmentation level increase over time. This will allow us to measure the extent to which the actions taken by the brand have improved the quality of the base over time. Finally, the downstream flows, i.e. the customers who move from one segment to a lower one, will allow us to see to what extent attrition is an issue to work on as a priority.
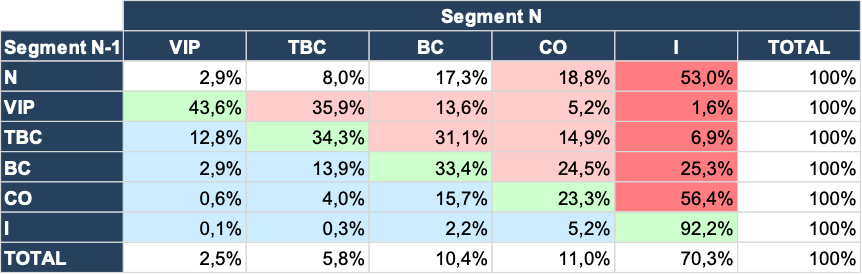
If we look in detail at the results presented in this matrix, we can see that 43.6% of VIPs have remained VIPs, 34.3% of very good customers (TBCs) have remained TBCs, etc. These levels of stability are fairly average and highlight a problem of loyalty among the core target. It will be necessary to implement specific actions on these segments to increase their commitment. It should also be noted that 53% of new customers (N) become inactive after one year. The nursing plan could therefore be improved in order to improve the quality of recruitment over time. We also note that nearly 25% of good customers (BCs) and more than 50% of COs become inactive after one year. It would therefore be interesting to work on the anti-attrition processes for these targets.
To sum up, the analysis of the transition matrix will make it possible to identify the major issues on which to focus the animation strategy (nursing, anti-attrition, reactivation, loyalty of the core target group, etc.) and to determine the additional analyses to be carried out to optimize the action plans.
How does datacadabra support you on the subject?
Within the Segment module, the different segmentation methods natively propose the transition matrices over different periods. They are enhanced with automated comments to measure the observed performance.
Want to know more? Do not hesitate to contact us or to ask for a datacadabra demo.
