Characterize your segments and adapt your marketing strategy

When developing your marketing strategy, it is essential to define your different segments in order to build a solid analytical base.
When you want to optimise your marketing and CRM strategy, you often start your customer knowledge work by implementing your analytical base.
The first step is to characterize your segments by setting up a customer segmentation. This will enable you to identify the main groups to be managed and to define the main actions to be carried out on each of them.
In order to better understand the characteristics of each group, it is often necessary to characterize your segments. Indeed, whatever the segmentation carried out, it is interesting to understand the profiles of the different segments in order to improve the customization of the segmented animation plan.
Example 1: Differences in consumption per channel
In terms of implementation, characterizing segments is based on an analysis of customer profiles and their consumption according to the segment to which they belong. It will thus be possible, for example, to analyse the distribution of segments by consumption channel.
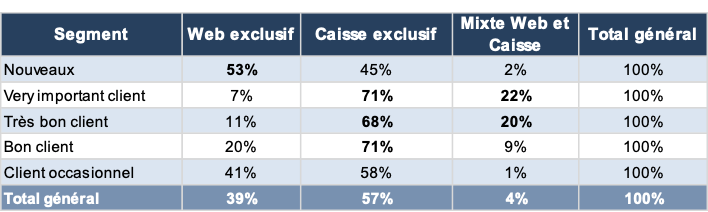
The table above shows that Very Important Customers and Very Good Customers are over-represented among mixed customers. While New Customers are over-represented among exclusive web consumers and Occasional Customers are more likely to buy in-store.
This information will allow either to direct customer communications towards the preferred channels of each segment, or to favor omnichannel by proposing offers in favor of the complementary channel.
Example 2: Differences in product consumption
In the same way, it will also be possible to analyse the consumption of the different segments by product family.
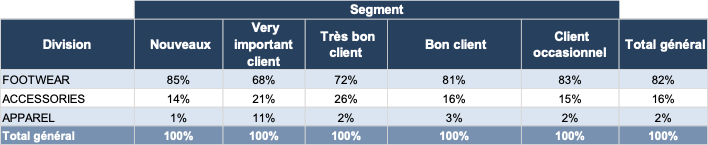
The table above shows that Very Important Customers are over-represented in the Accessories family and especially in the Apparel family. The Very Good customers are over-represented in Accessories.
We will therefore personalize the product offer according to the segments. In parallel, we can deduce that diversification in terms of products is also a vector of loyalty. It will therefore be appropriate to highlight certain products to the soft core segments to increase their knowledge of the brand, their consumption and therefore their loyalty.
Example 3: Differences in sociodemographic profiles
Another element that will be important in understanding the different segments is the analysis of their sociodemographic profile. This will enable us to understand the differences between the different segments in terms of age, sex, socioprofessional category, standard of living, etc.
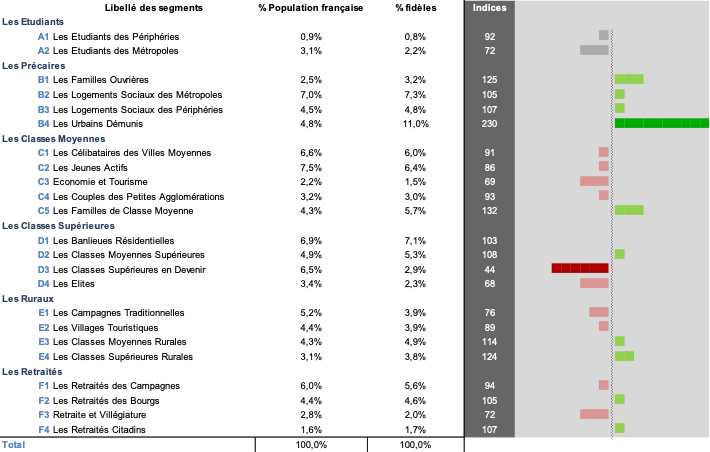
The graph above gives an example of the characterization of loyal segments versus the population through GeoTypo. We can see here that the active segments are over-represented in rather urban and SPC- areas, whereas they will be under-represented in SPC+ districts.
This socio-demographic information will also make it possible to improve the digital acquisition process by focusing on the characteristics of the most loyal segments.
How does datacadabra help you characterize your segments?
As we can see, the characterization of segments will make it possible to find numerous drivers for improving communication. Within datacadabra, the Describe module will allow you to work on different types of profiles, on the brand’s own data or on Open Data.
Want to know more? Do not hesitate to contact us or to ask for a datacadabra demo.
